Predicting Food Insecurity
SNAP quality control data collected by the USDA Food and Nutrition Service were used for this project. Data from two years (2007 and 2017) and from two states (New Mexico and Nebraska) were selected. The 2007 data captured a time before the financial collapse in 2008, and 2017 represents households after a ten year recovery period. Previous geographical research had indicated increases in SNAP benefits in New Mexico and a reduction in Nebraska. This comparison will help us identify which household factors are the best predictors for someone being eligible for SNAP benefits. This information can then be use to make predictions for future SNAP benefit eligibility.
Both datasets required significant cleaning to be useable. Python was used to:
Adjust coded responses of eligible/ not eligible so that all responses used the same standard of 0= Not Eligible and 1=Eligible across datasets
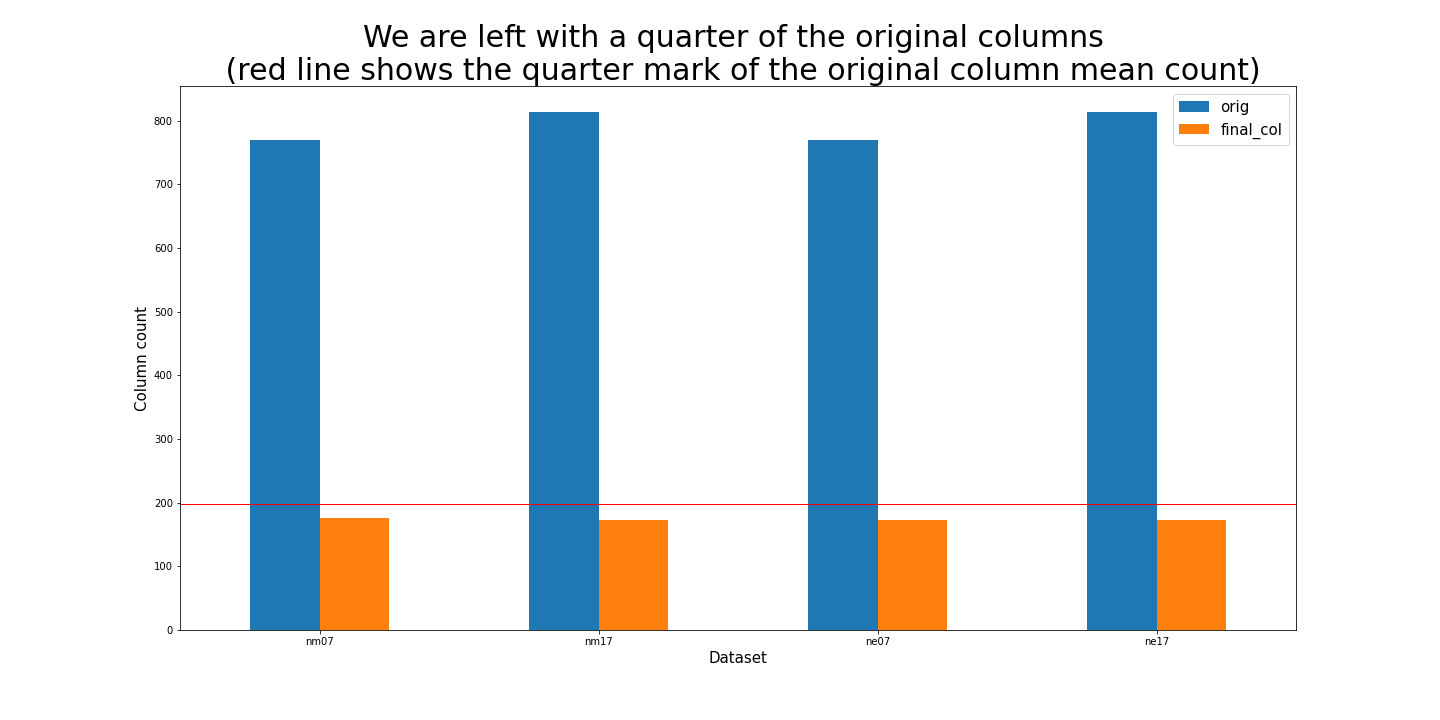
Remove null columns, identify/remove columns that have >50% of data missing and finally remove columns that only have zeros.
Replace null values in remaining columns with column averages using scikitlearn SimpleImputer.
Remaining columns now had complete, meaningful data for analysis as is shown in this Python bar graph for each of the four data sets:
Correlations were assessed between different variables and SNAP eligibility (‘CAT_ELIG’) and graphed. The following is the graph set for 2007 New Mexico data and compares variables in six sub-categories to SNAP eligibility. Correlation graphs for the other datasets can be found HERE on my Github. For this data set, ‘TANF_IND’ is the highest correlated variable, which represents an individual receiving benefits from TANF (Temporary Assistance for Needy Families).

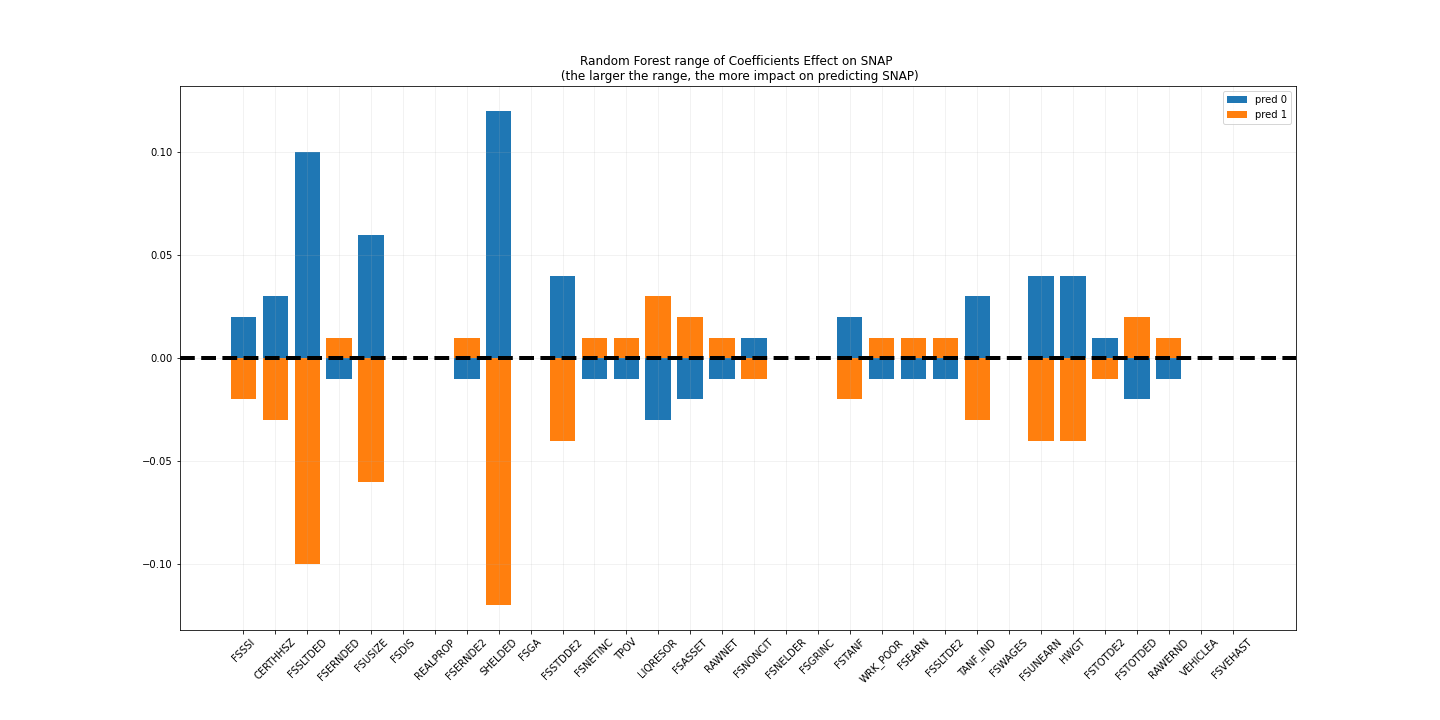
Once correlated features were identified, a model was created. This started with a train/test in which 70% of the data was used for training and the remainder for testing. Three different interpretable models were assessed and the Random Forest Classifier was selected for use with the highest accuracy score, though all models had accuracies above the established baseline. Predictions of impact for features were graphed, and the top two variables (‘SHELDED’ and ‘FSSLTDED’, both having to do with housing deductions that extend to unsheltered/homeless populations) were identified to have the highest positive correlation in identifying SNAP eligibility.
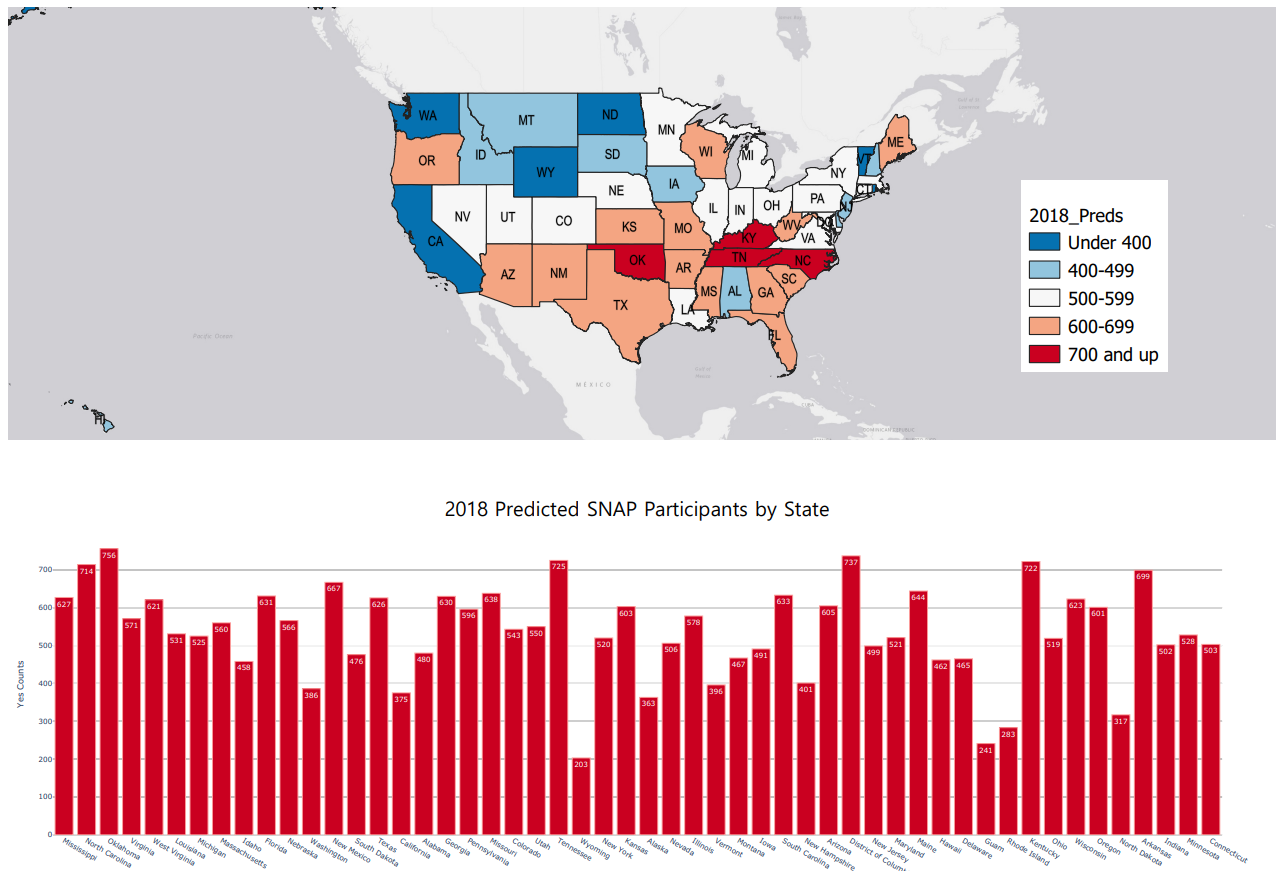
Next, the model was used to predict SNAP eligibility by state for 2018. This data was visualized with QGIS Desktop (version 3.18.1). Symbology was assigned by group to make understanding eligibility predictions simpler, and four states were identified as being the most likely to have the highest number of SNAP eligible individuals in 2018. Those states were Oklahoma, Kentucky, Tennessee and North Carolina.
This data can be used by state governments to assess their citizens’ likelihood of SNAP eligibility and allow for time to support those individuals. Furthermore, it gives states an identified fund target to help reduce the need for SNAP in the future- by increasing funding for secure housing and reducing the amount of shelter deductions that need to be claimed, the need for SNAP benefits may also be reduced.
All python code and QGIS files created for this project can be found here.