Field Collection Workflows, Mobile Map Packages and Dashboards
A product that provides spatial data and associated analyses in an easy-to-access form is the most basic goal of GIS. Optimizing the sharing process through comprehensive workflows is key to providing end users with the best product. The following projects illustrate workflows and leverage a variety of Esri products to provide workforce and end users with the information they need to make informed decisions.
ArcGIS Apps and General Workflow for a Parks and Recreation Project

The following chart was created with diagrams.net and outlines seven of the ArcGIS apps that can work together for a proposed park mapping project. These apps work together to help assign workers to specific areas, allow workers to capture data (including accessing maps or uploading photos) and to monitor worker progress. The content of these apps could be used in a dashboard to keep dynamic information available in one easy to access place.
Flowchart with seven AGOL apps and their uses.
Webmaps and Dashboards for Neighborhood Permiting
An AGOL template for permitting was used to create hypothetical permitting requests in a local neighborhood. Collector was used while walking though the neighborhood to identify the location and type of each permit being requested. The webmap can be viewed here.
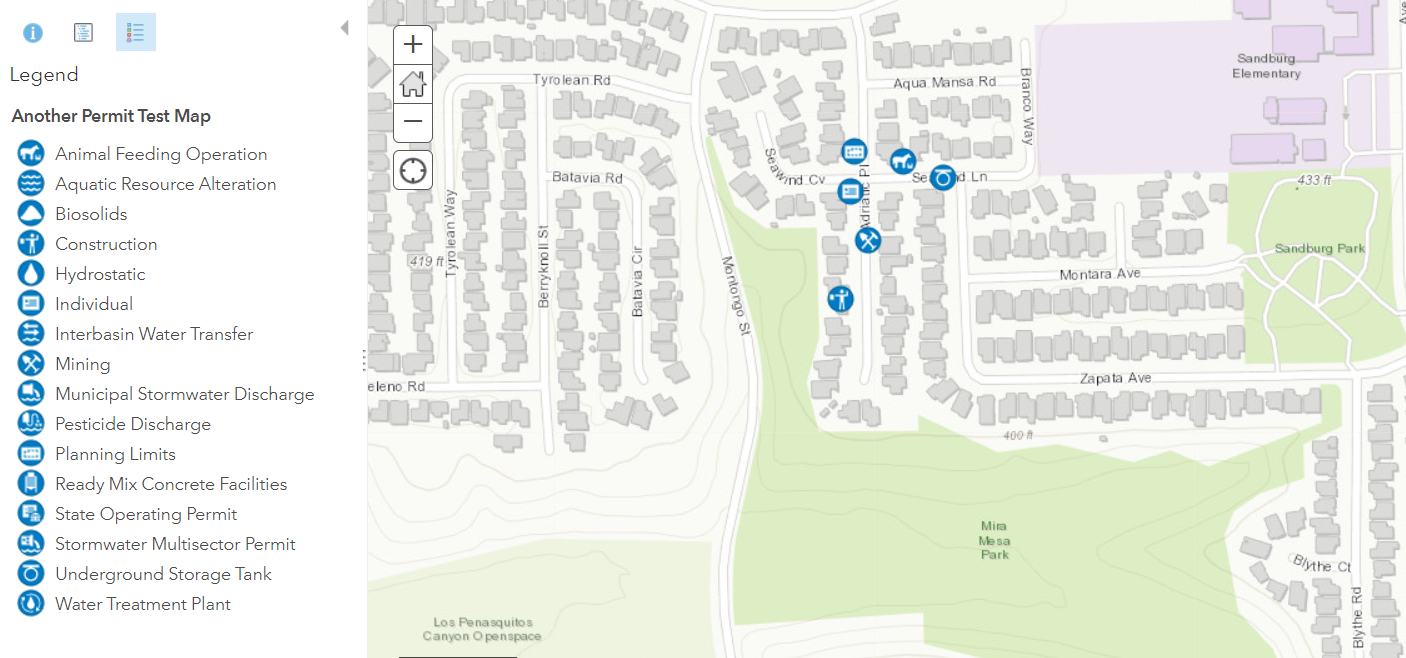
A webmap created from an AGOL template and used to identify hypothetical permit applications in a neighborhood via ArcGIS Collector.
The data was then used to create a dashboard to display multiple permit details in once place. The dashboard can be viewed here.

A dashboard utilizing the permitting webmap to display relevant information in one place.
Survey123 was used to create a road assessment survey. This survey could be offered to residents or an assigned work crew in a target neighborhood in order to better understand road maintenance issues. The answers from this survey would be useful in aiding local officials as they prioritize road work projects. The survey can be viewed here. Screenshots below illustrate the flow of the survey, and how the next question asked is based on the previous question’s answer. A mobile map package was created for offline survey entries, available for download here.
Survey Design and Offline Survey Use
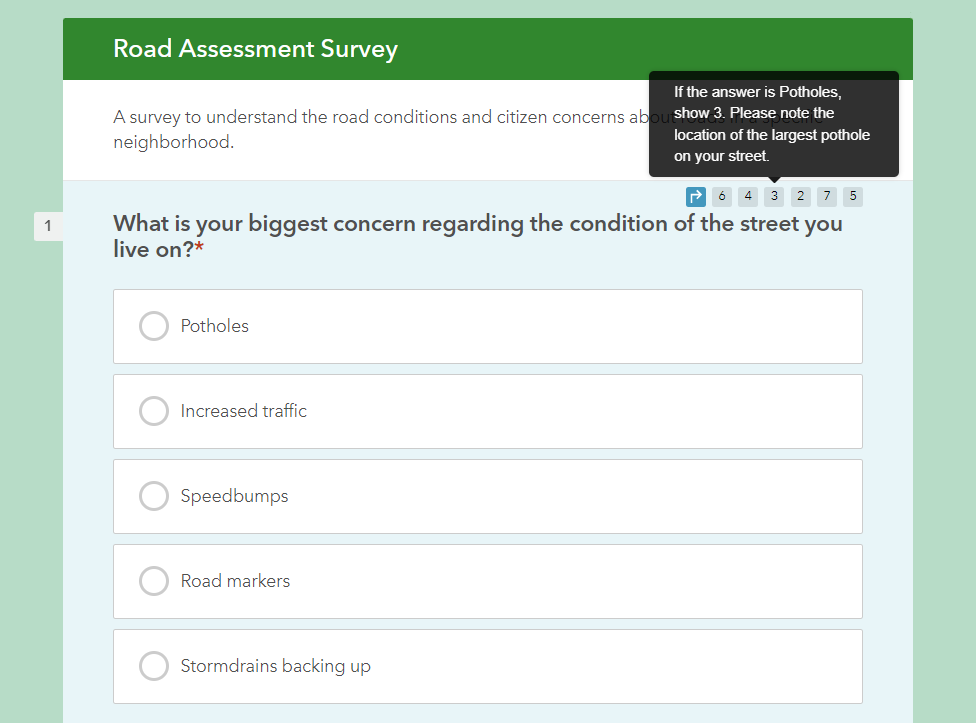
The first question in a road survey. The survey flow is noted in the upper righthand portion of the screen to denote the next question to be asked based on this question’s answer.

The next question to be asked when a participant selected “Potholes” as their biggest road concern is a interactive map that asks for spatial data (in this case, the location of the largest pothole).
Creating a Workforce Map for Fire Hydrant Assessment and Repair
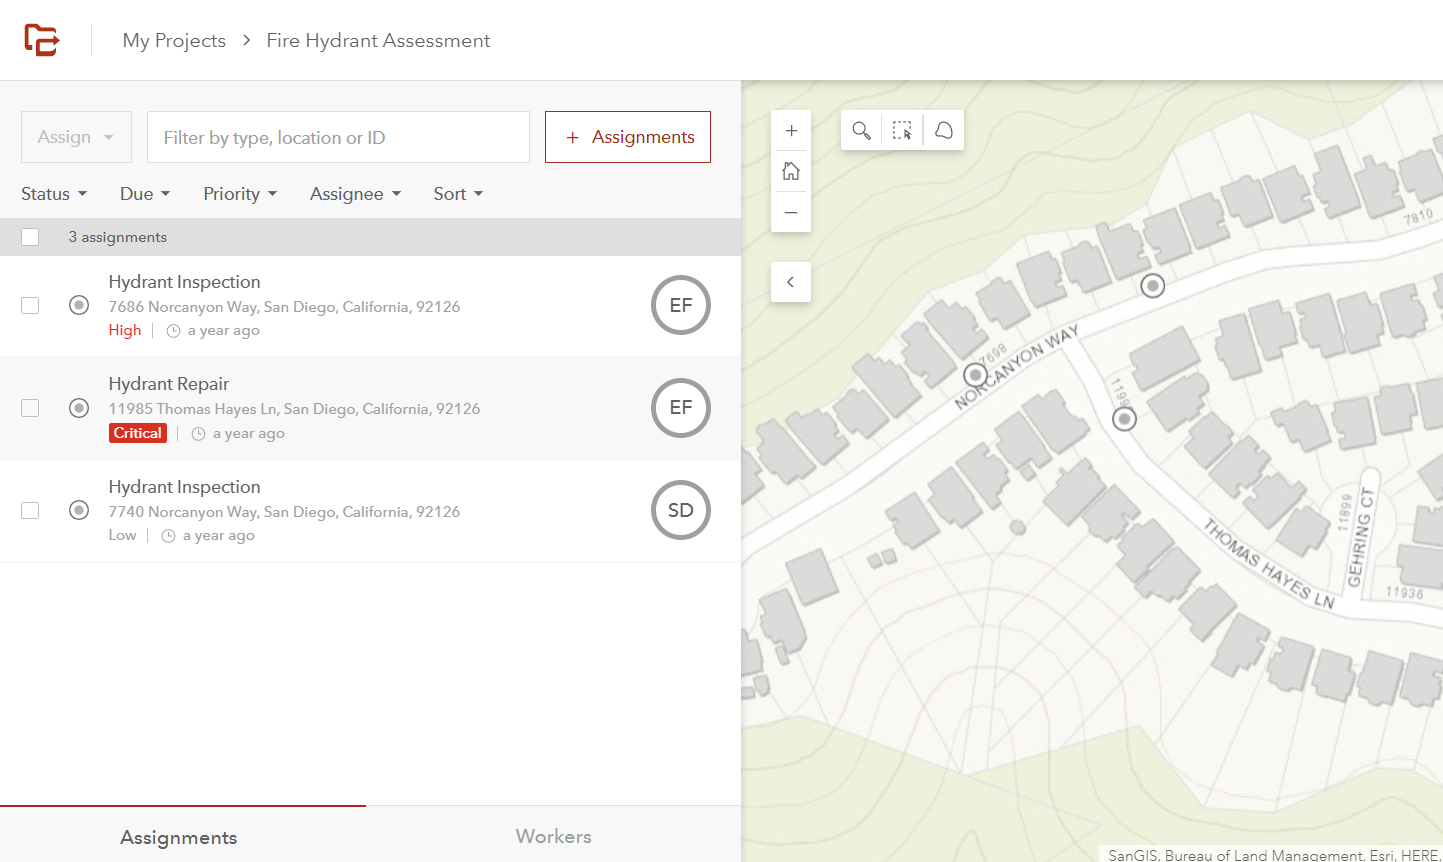
A dispatch map in Workforce illustrating three hydrants in need of repair or inspection.
A Workforce project was created for the purpose of assigning and keeping track of fire hydrant assessment and repairs. The webmap can be viewed here. In this screenshot, there are three hydrants with different tasks that have been assigned to two workers.
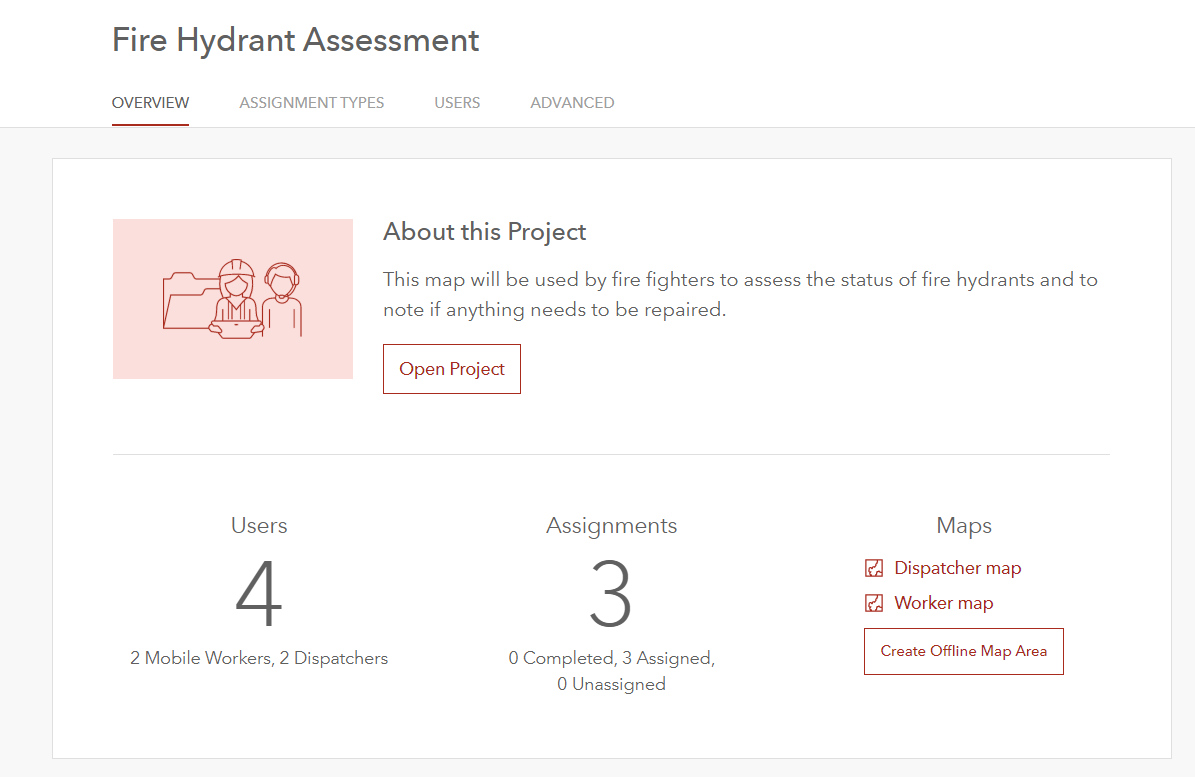
The project overview that shows how many workers, dispatchers and assignments are attached to the map.